Shiba Inu (SHIB) Expected to Soar: Analyst Predicts Price Surge to $0.000059

In a recent analysis, Alikze, a prominent TradingView analyst known for accurately predicting the current downturn of Shiba Inu (SHIB), foresees an imminent price surge to the $0.000059 range.
Early Predictions and Market Movements
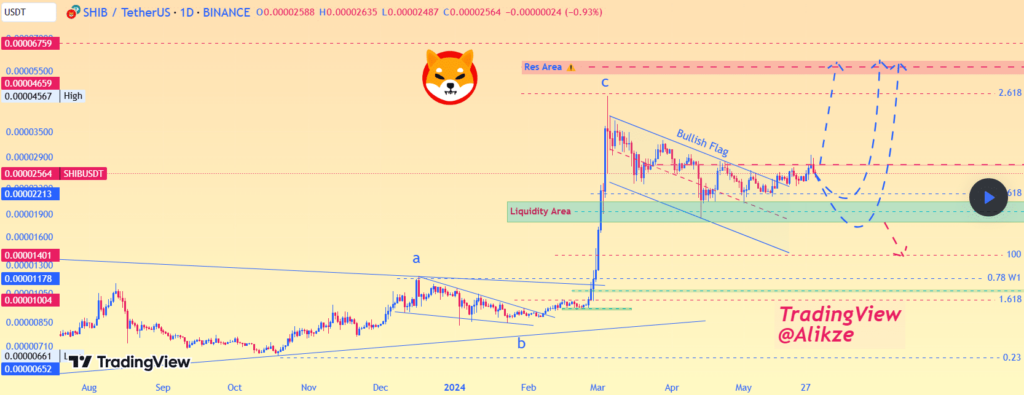
Alikze first presented his analysis on May 31, during the early stages of the bearish trend. At that time, SHIB was trading between a low of $0.00002487 and a high of $0.00002635. Despite the downturn, SHIB remained resilient above the $0.00002 level, with attempts to retest the $0.00003 mark.
While many analysts anticipated a sharp decline, Alikze proposed a final target above $0.00005, suggesting SHIB might follow one of three possible paths to reach this level.
Potential Paths to Recovery
- Direct Surge to $0.00005: The first scenario mirrors the expectation of most analysts, where SHIB would directly climb to $0.00005.
- Retest of Liquidity Zone: In the second scenario, SHIB would retest the liquidity zone between $0.00002084 and $0.00001786 before surging to $0.00005. This zone is seen as a strong support level.
- Breakthrough of Liquidity Zone: The third path involves breaking the support at the liquidity zone, potentially dropping SHIB to $0.00001707 before any significant rise. This scenario ultimately played out, with SHIB breaking through the liquidity zone and currently trading at $0.00001716.
Recent Performance and Future Projections
After ending June with a 32.13% drop, SHIB broke through the liquidity zone. Despite this, Alikze predicts an imminent recovery, expecting further declines to the 100 Fibonacci area, aligning with $0.00004. He anticipates this region to act as a launchpad for greater gains.
The Road to $0.00005
Once this anticipated rise materializes, Alikze maintains his initial target of $0.00005. Specifically, he predicts SHIB will reach a price range of $0.00005387 to $0.00005937, a zone identified by market commentators as a resistance area.
The last time SHIB saw these prices was in November 2021, following its all-time high of $0.00008845.
Market Indicators and Exchange Flows
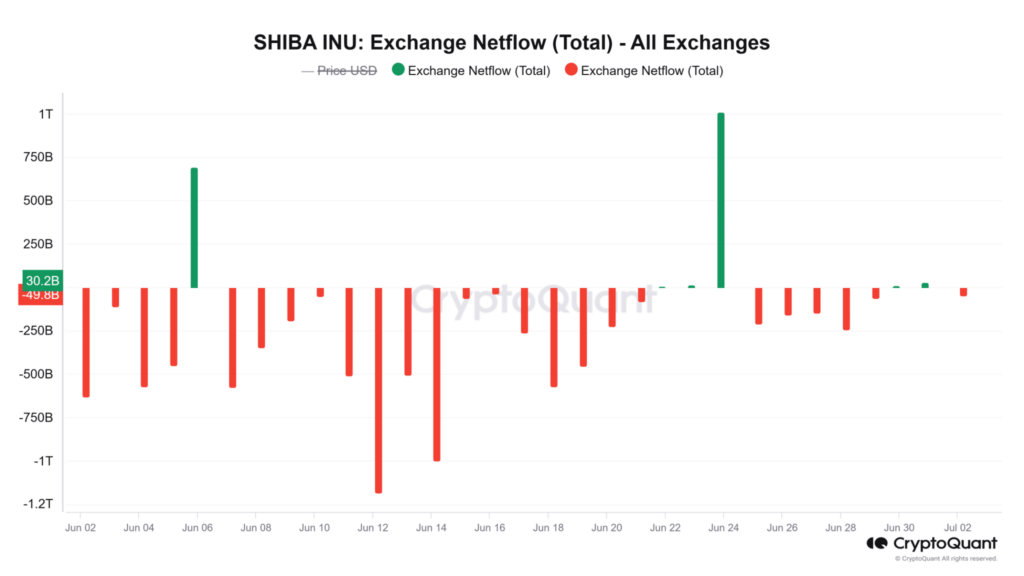
CryptoQuant data indicates that since June 2, SHIB has recorded 23 days of negative exchange flows, with over 8.6 trillion SHIB moving out of exchanges in the past month. This ongoing trend of net outflows could provide SHIB with the momentum needed for an upward push.
Read more Shytoshi Kusama Reveals His Location and Plans for Shiba Inu Ecosystem
Despite a slight increase at the start of July, SHIB’s price has dipped by 0.45% this month. However, with its Relative Strength Index (RSI) currently at 33.68, SHIB is hovering around oversold territories. Furthermore, the Market Value to Realized Value (MVRV) for SHIB has dropped to -1.5, indicating potential for an upward correction.
Important Notice: The content presented in this article is intended for informational purposes only and should not be interpreted as financial advice. Coinshibainu.com bears no responsibility for any investment decisions made relying on the information contained herein. It is highly recommended to consult with a qualified expert or financial advisor before making any investment decisions.